Google Data Studio: Open Your Eyes To Reporting Automation

Let’s look at the results from the survey to put some context around my thoughts…

At the end of 2018, I put a survey out on Twitter in a quest to find out how many people were still pulling together marketing performance reports manually. The results really shocked me. From that day on I started to talk more about Google Data Studio and share my knowledge with people to help them begin to automate their reporting.

Reporting Tools Survey

We can see from the above that a large percentage of the audience were using Microsoft Excel for their reporting which identified a big gap in those who automated and those who did not. Over 450 people were surveyed in this poll.

Going one step further, I then put out a second survey to find out how many hours advertisers tend to spend putting together monthly performance reports for websites. Can you believe that over 34% spent more than 3 days a month! Over 150 people were surveyed in this poll.

Time Taken On Reporting

Earlier this year, I presented at InOrbit (March) and SearchLeeds (June) sharing some tips and ideas for using Google Data Studio to automate reporting across the various digital marketing channels.

Following on from the feedback from my talks, I then created an online course teaching people how to use Google Data Studio to automate their reporting.

I have had some great feedback from the course so far. Checkout the course here if you are interested.

I also wanted to write up some of the tips and techniques I shared in my talks so as to inspire more people to begin their reporting automation journey. There are obviously so many more ways you can use Data Studio for the various channels but hopefully this post gives you some ideas to inspire you to checkout Data Studio and start saving yourselves hours and if not days of time each month.

So let’s get started…

Data Studio for SEO

Google Data Studio can link up with all the standard Google tools with the most popular connector being Google Analytics. Whilst Google Analytics is a must have connector within the platform, we can also hook it up to other platforms such as Google Search Console and Google My Business. At present, the Google My Business connector is not a free connector but it can be used if you use the third party connector via SuperMetrics.

Google Search Console

Here you can see an example report which provides you with lots of insights from Google Search Console (GSC). The data is pulled in directly from GSC and we can monitor performance trends across the site. We can also start to recoup some of the organic keyword data that Google Analytics removed over five years ago!

Google Search Console

Another great dashboard you can create using Google Search Console is to show you the breakdown of brand vs non brand keyword performance. Applying simple include and exclude filters to reports allows you to monitor organic query performance over different periods of time. This can help you to understand whether the SEO work you are doing to enhance your sites visibility for non-brand terms is having the desired effect rather than purely relying on rankings.

Google Search Console Brand Keywords
Google Search Console Non-Brand Keywords

Google My Business

The last example I want to show you is the connector with Google My Business. As mentioned above, this is not currently a connector that Google have open sourced so you can only make use of it if you pay for a third party connector.

Once you have hooked your GMB account up with Data Studio, you get access to so much valuable information. If you have multiple GMB profiles, you can use Data Studio to amalgamate the data into one useful report.

In the example below you can see the GMB profiles visibility broken down by month. We can get access to all the useful metrics GMB provides but it is shown in an easy to read format.

Google My Business

From a customer service standpoint, it is also very useful as it can import any reviews your customers have left on your profiles. If the comment has not had a reply from someone at your organisation, it is easy to spot and encourage someone to reply.

Google My Business Reviews

Data Studio for PPC

Using Data Studio for PPC has completely changed how I manage campaigns. It has opened my eyes to areas of accounts that need looking at which would have previously taken me longer to identify. With the visual dashboards Data Studio gives us, we can see so much more and it can help us to prioritise tasks to boost performance.

Google Ads

The most used connector is Google Ads. It has been open sourced by Google so doesn’t come with any costs attached to using it.

The below example of a Revenue vs ROAS report helped one of my clients to see just how much Google Shopping was pulling down the performance of the account overall. They made the decision to reallocate a large percentage of the Shopping spend over to Search and the ROAS across the account improved significantly after this time.

ROAS for PPC

MCC Hook-up

Working agency side, it is really useful if you can see the performance of all the accounts you or a team member manages from one dashboard. With the MCC Hookup feature in Data Studio, you can create one dashboard with links to each account you manage so you can easily navigate down the list to spot any potential causes for concern without having to login to the Google Ads interface.

This same functionality applies with Facebook Business Manager but you would need the paid for connector to do this.

MCC Google Ads Hookup

Auction Insights

One of my favourite reports in Data Studio for PPC is the Auction Insights report. When you look at this data directly in the Google Ads interface, you need to look through all the different numbers to see whether a new competitor has come into the marketplace or whether an existing competitor has ramped up their spend.

You can see from the below screenshot that I have graphed the Auction Insights data to show me competitor overlap by domain over time. From May 2019 to June 2019, Amazon.com have become more prominent in the auction I am advertising in which could result in a drop in conversions for my client.

Likewise, we can also see that the dark grey competitor who appeared for the first time in May has gone away again but the pale green competitor has significantly increased their visibility in the auction.

I use this data to tell me when I should be doing further competitor analysis. If I see a new competitor come into the auction it automatically triggers me to check them out.

PPC Auction Insights

Data Studio for Paid Social

If you are anything like me, I like to be able to see data for all the campaigns I am running in one place. Before Data Studio came out I would spend hours working my way around the various paid social platforms making sense of the performance. The Data Studio connectors for all the different platforms saves me so much time each month.

Facebook Ads

The below dashboard enables you to track your campaign performance from a top level perspective as well as drilling down to various ad sets in the account. It has broken down the lead data by demographic and also shows us where the bulk of the paid social traffic has come from geographically.

Facebook Ads

Example from Social Media Examiner

Comparing Facebook Ads with Google Ads

Data Studio gives you the ability to see your performance metrics side by side for different marketing channels.

This example from SuperMetrics shows you how you can visually compare metrics for Google Ads alongside Facebook Ads.

These reports update automatically and they also take into consideration conversion windows which means you will be able to keep track of conversions that have been attributed to previous ad clicks.

Facebook Ads and Google Ads

Quora Ads

One of the more recent additions to Data Studio is the Quora Ads connector. SuperMetrics have created the connector and they have put together this example dashboard to show us how it can be used and the data we can obtain from the platform.

Quora Ads

Data Studio for Content Marketing

I have spoken to lots of people who work in Content Marketing or Digital PR who are using spreadsheets to keep track of the results and coverage they are delivering for their clients. It is a very manual task and can be very time consuming.

Let’s look at a few examples of Content Marketing and Digital PR dashboards that have been created via Data Studio.

Blog Content Performance

By adding a filter to your reports that are pulling in data from the Google Analytics connector, you can choose to report purely on traffic coming into the blog. This example shows various metrics, all of which are specifically for the blog.

The second set of reports shows where the traffic to the blog is coming from and also which blog posts are getting the most traffic. All this insight can help you to write more insightful content and continue driving results for the blog.

Blog Performance 2

Email Marketing

With the MailChimp connector via SuperMetrics, you can create a dashboard that summarises all the results for your email marketing campaigns. From Open Rates and Click Rates through to actual conversion metrics, this connector can summarise the performance amazingly.

MailChimp Email Marketing

Data Studio for Display Advertising

If you are running Display Advertising with Google, you automatically get access to the connectors for the platforms such as Display 360.

Let’s look at some examples of dashboards used for Display Ads.

Overall Performance with Display 360

This example shows you your overall performance for your display advertising campaigns with six different filtering options so you can drill the performance down by:

  • Partner
  • Advertiser
  • Campaign
  • Insertion Order
  • Line Item
  • Creative
Display 360 Performance

Placement Performance

If you are running your Display campaigns directly via Google Ads, you can setup a dashboard to monitor performance by Placement.

High performing placements need to be managed separately to other placements and this report will uncover those best and worst performers.

Display Placements

Summary

Now that you have seen a selection of dashboard examples that you can create in Data Studio, why not have a go at creating your own. Once you have got your head around the platform and its capabilities, I promise you that you won’t ever go back to manual reporting again!

If you are looking to get started and you are not familiar with the platform, you could sign up to my Online Google Data Studio course for just £299 for lifetime access.

The course will be updated as and when new features are released so you can keep coming back to learn how to implement them.

5/5

Share this post

Share on facebook
Share on google
Share on twitter
Share on linkedin
Share on pinterest
Share on print
Share on email

3 Responses

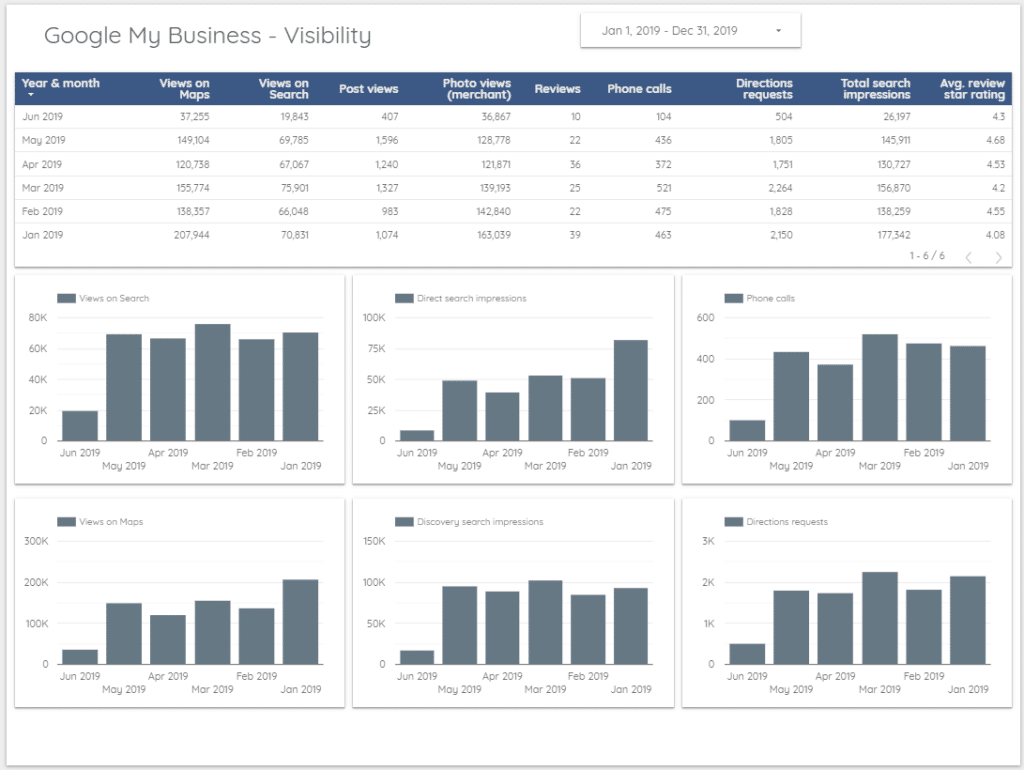
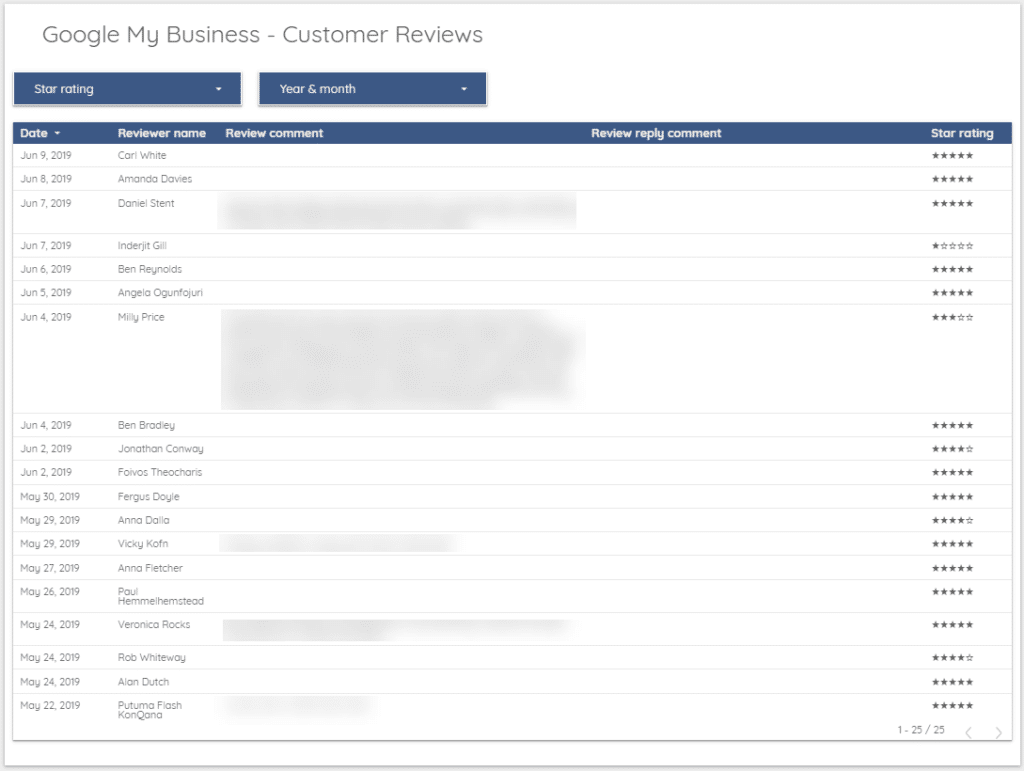
  1. Hi Sam, love the post! One note, Jepto makes a free connector for GMB which works great, although it does not have all of the metrics that the supermetrics connector has. There’s really no reason not to be automating your GMB reporting!

Leave a Reply

Your email address will not be published. Required fields are marked *